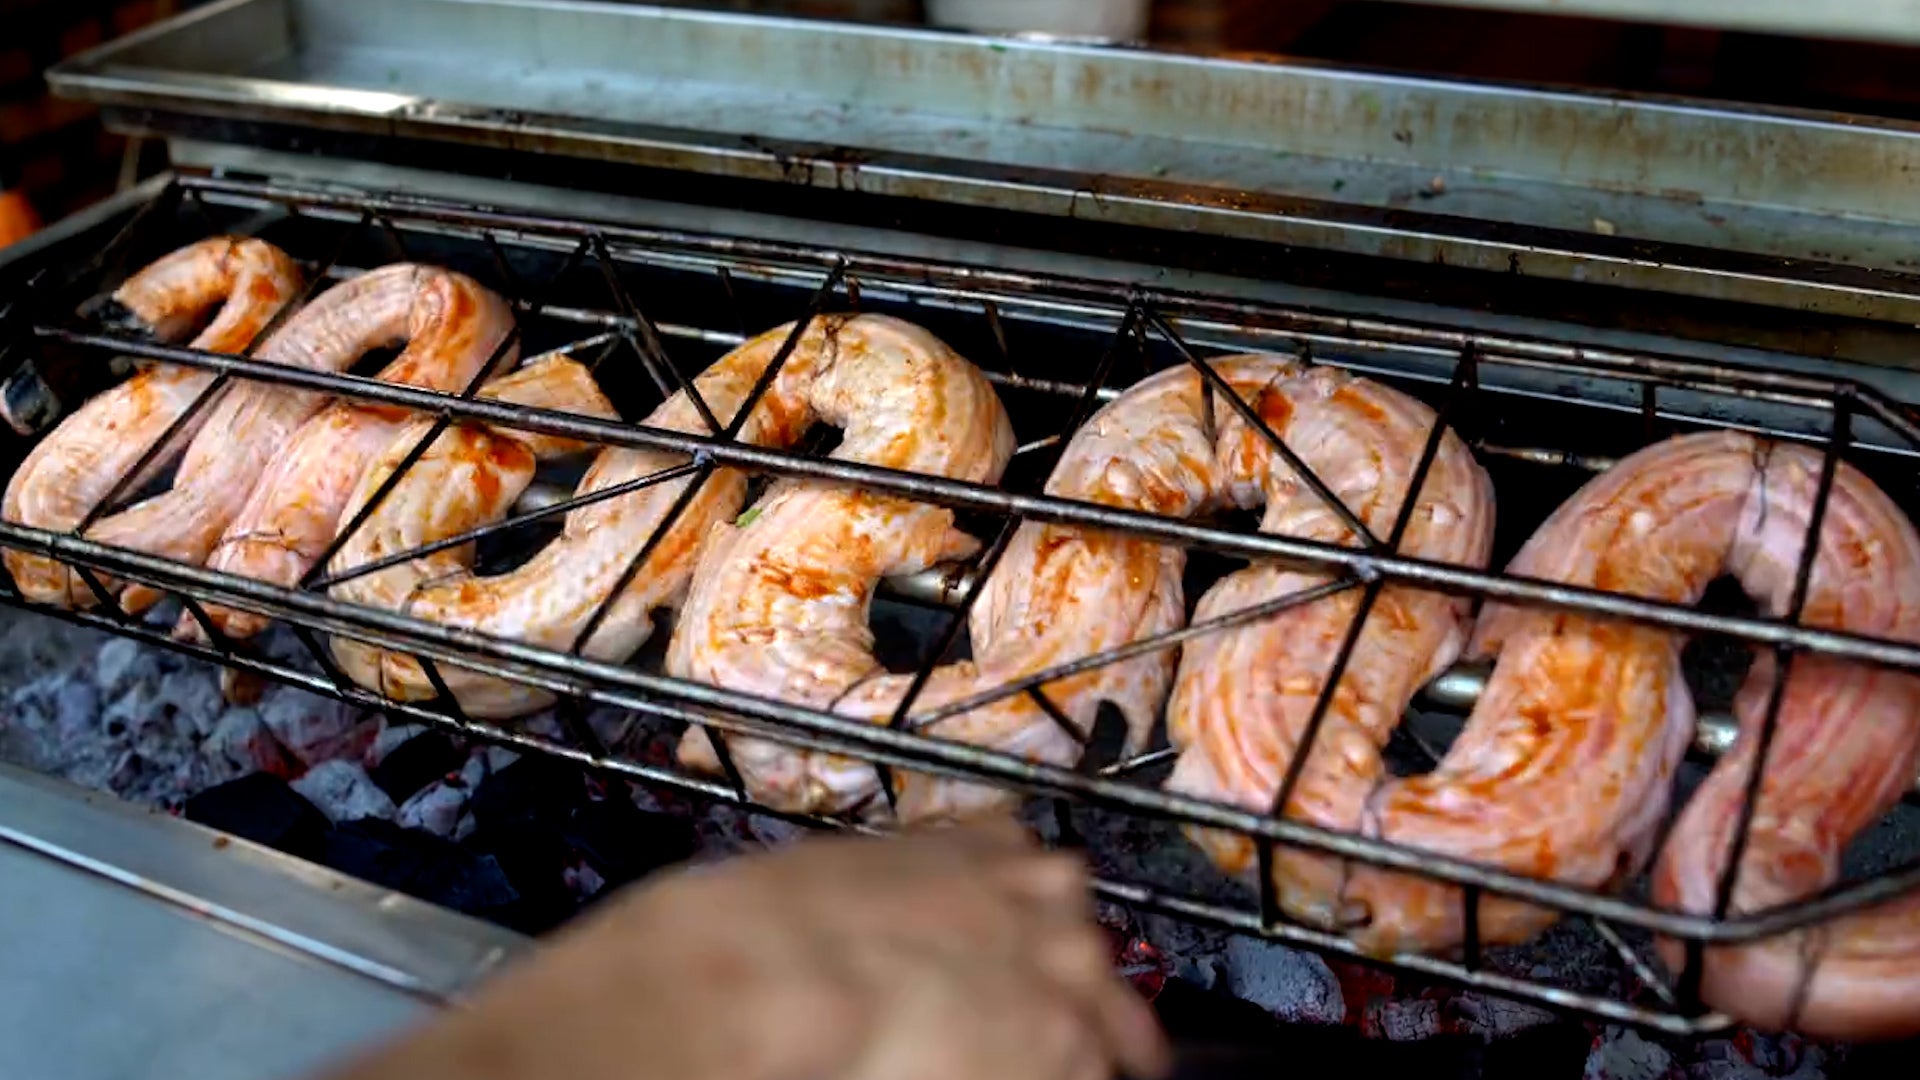
Could this cold-blooded reptile be the next big thing in food trends? It’s cheaper to farm, more sustainable, requires less animal feed to be manufactured and it’s even good for you. While the trend shift could be years in the future, pythons could one day constrict the meat industry.
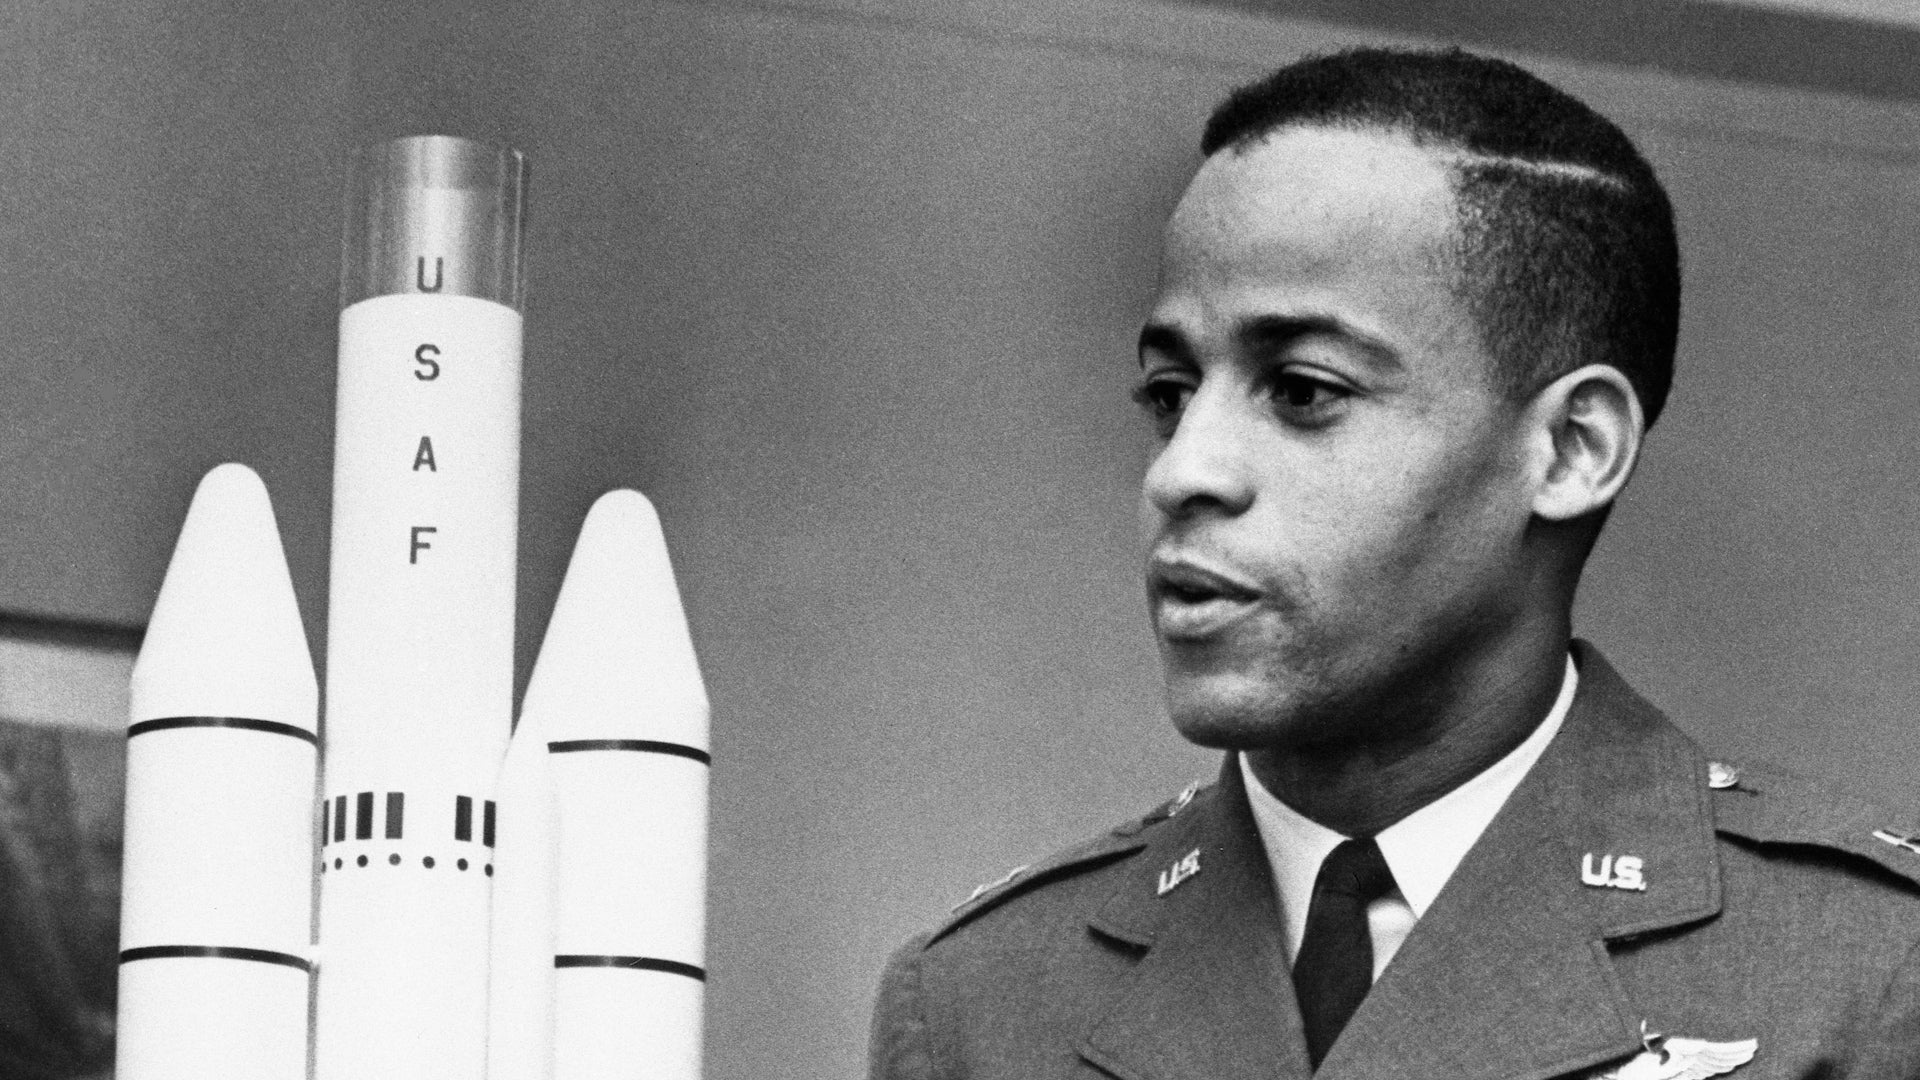
Decades after being poised to become America’s first Black astronaut, Ed Dwight will finally gaze upon Earth from space aboard Blue Origin’s NS-25 mission at the age of 90.